Confidence in the Garden: Understanding BirdNET-Pi Confidence Scores and Why They Matter
2025-04-24
One of the joys of setting up a BirdNET-Pi in the garden is that it turns your everyday green space into a hub of real-time bioacoustic science. Every chirp, tweet, and call becomes a data point. But when we look at the results—particularly those elusive confidence scores many of us wonder: What exactly do these numbers mean? And how much can we trust them?
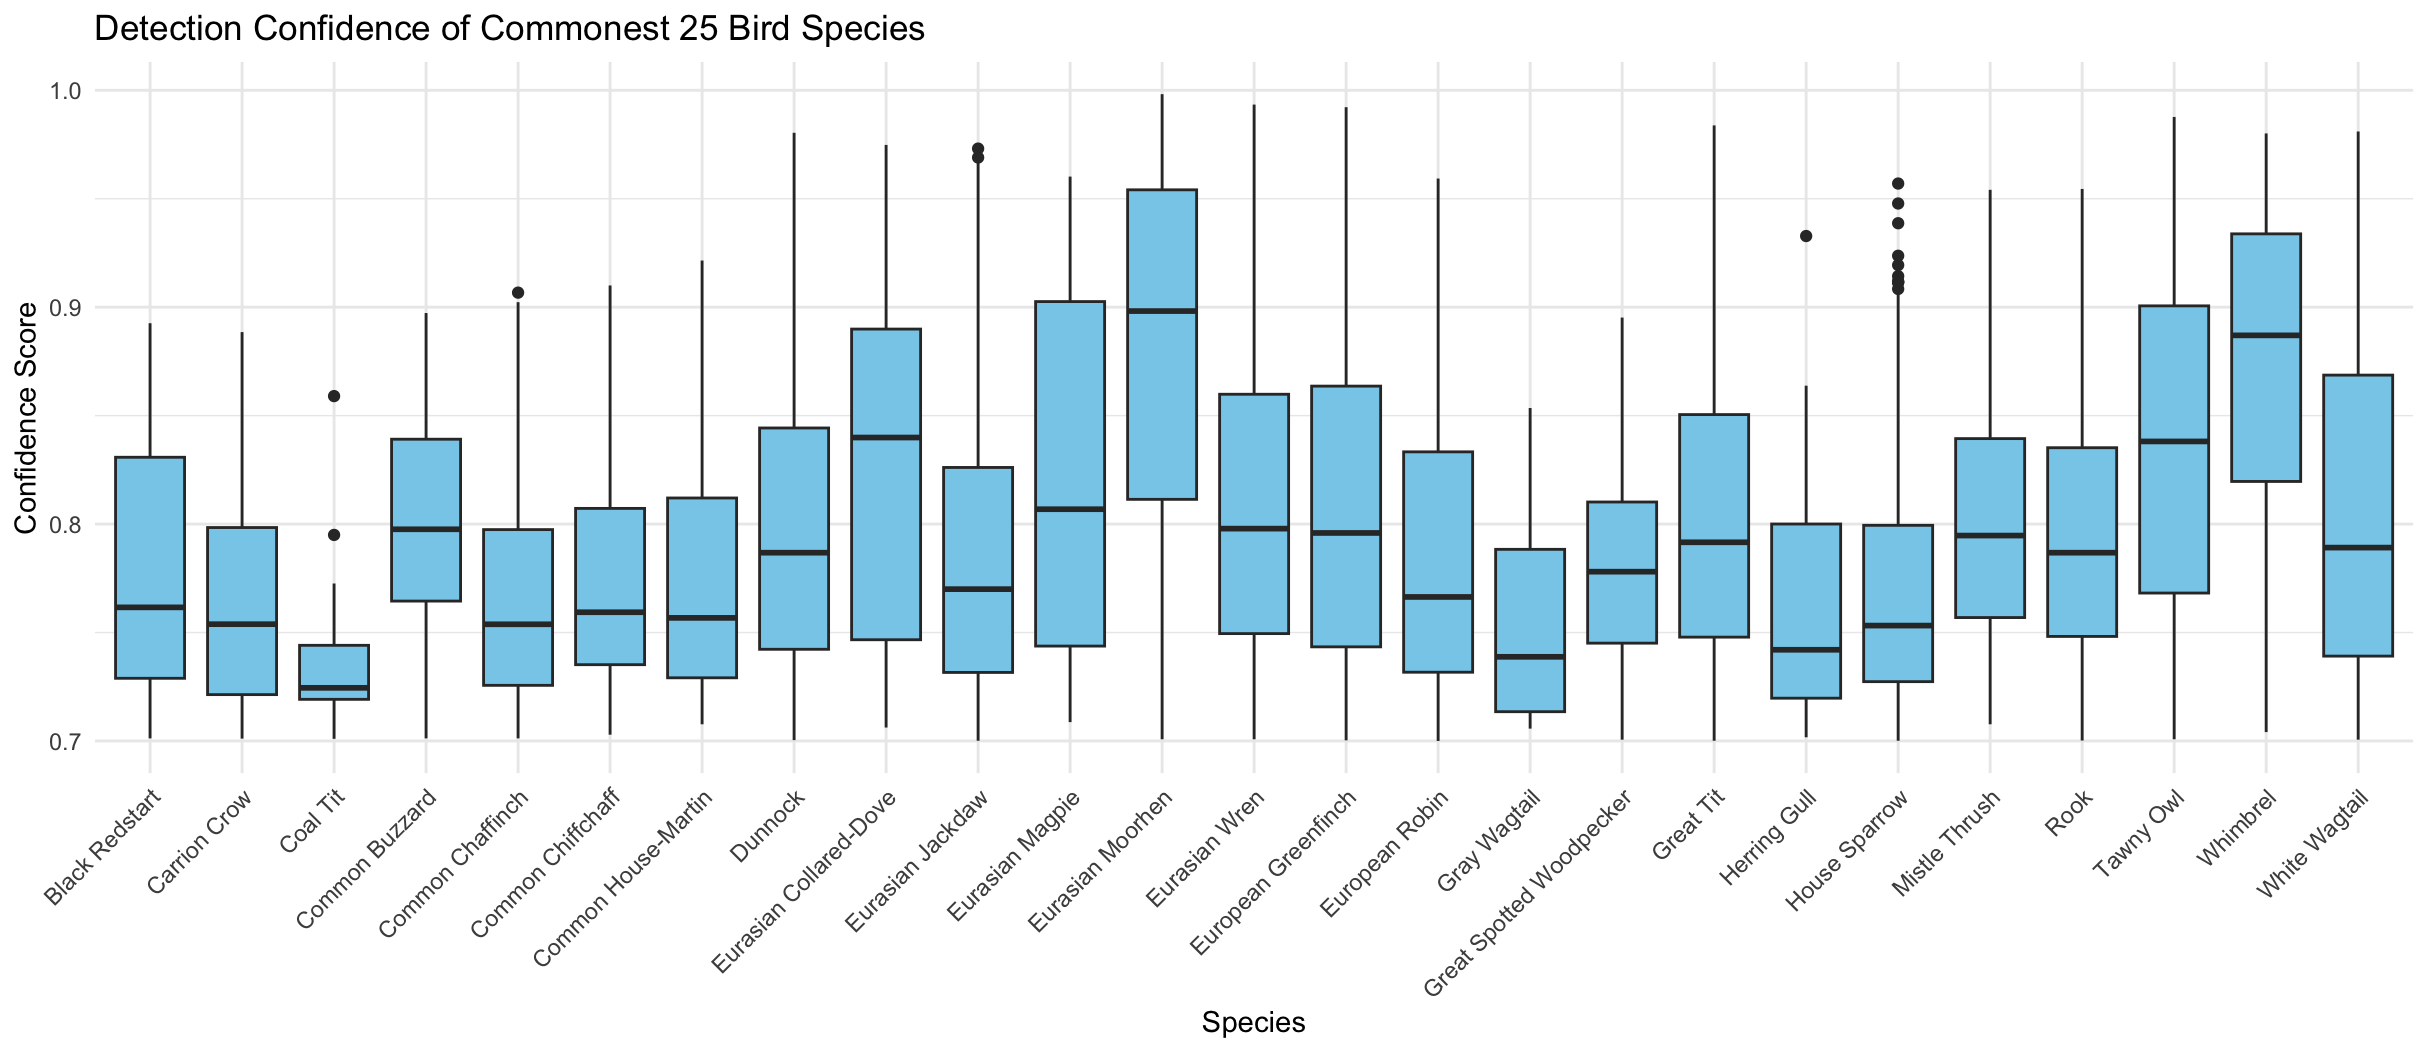
Let’s unpack what confidence scores are, how they’re used in BirdNET-Pi, and what insights we can pull from visualizing them, like in the box plot I generated from my garden’s data:
What is a Confidence Score?
In the world of machine learning and AI, a confidence score is a number (usually between 0 and 1) that tells us how certain the model is that it has made the right prediction. In the case of BirdNET-Pi, this means: How sure is the system that the bird call it detected belongs to a particular species?
If the system hears a song and assigns a confidence score of 0.94 to a Great Tit, it’s very confident. If it gives only 0.72 for a Goldfinch, it’s not so sure.
These scores are not random—they’re derived from deep learning models trained on thousands of real bird vocalizations. But even the best models have limits, especially in real-world environments full of overlapping calls, wind, rain, or traffic noise.
Before we dig into the BirdNET data specifically, let’s briefly detour into statistics. A confidence interval is a range of values, derived from sample data, that likely contains the true value we care about.
Say you’re measuring the average height of sparrows in your garden. You might find a mean of 16 cm, with a 95% confidence interval of [15.7 cm, 16.3 cm]. That means you can be 95% sure the true average falls in that range. It’s a way of expressing uncertainty—and it’s a concept that’s related (though not identical) to BirdNET’s confidence scores.
While BirdNET doesn’t give us formal “confidence intervals,” the distribution of scores across many detections acts like one. That’s where graphs like the one I generated become useful.
Interpreting the Graph: Confidence Scores Across 25 Bird Species
Recently, I collected data from my BirdNET-Pi setup in the garden and created a box plot showing detection confidence scores for the 25 bird species it picked up most commonly. Here’s what it revealed:
- Species like the Eurasian Jackdaw and White Wagtail consistently scored high, often above 0.9. The AI model is highly confident when it hears them.
- Others, like the Ring-necked Pheasant or Great Spotted Woodpecker, had wider spreads and lower medians—suggesting the model struggled more with these. There is some evidence that birds have local accents and I wonder if these are coming into play.
- Some species had lots of outliers, hinting at inconsistent recordings or background noise.
This plot is powerful because it helps me do three things:
Evaluate model reliability: If a species constantly has low confidence scores, maybe I shouldn’t treat its detection as trustworthy without more evidence.
Spot detection bias: Some birds might be misidentified due to overlapping frequencies with other species. A wide range of scores might indicate this.
Tailor my alerts and filtering: I might only log or act on detections with a confidence > 0.85 for certain species. Others, I might review manually.
Why This Matters for Garden Birding
In short - it doesn’t - if all you want to do is have an idea of what’s around. If, on the other hand, you’re using BirdNET-Pi as part of your bird monitoring, conservation efforts, or just for fun, understanding confidence scores helps you interpret your data responsibly. You don’t want to celebrate the return of a rare warbler only to realize it was just a noisy House Sparrow with a weird echo!
By looking at trends over time and visualizing confidence distributions, we start to go beyond passive detection and become more active, informed interpreters of the data. And the more we learn, the more meaningful our garden’s bird chorus becomes.
Practical Tips for Using Confidence Scores
Here are a few ways to make the most of your confidence data:
Set a filtering threshold: In BirdNET-Pi’s web interface or your CSV logs, you can filter to only include results with confidence above eg. 0.80 or 0.90.
Visualize trends: Use tools like Excel, Python, or R to graph detection confidence over time or by species.
Investigate edge cases: Low scores might point to interesting events—background noise, mimicry, or even unusual bird behavior.
Compare seasons: Are confidence scores better in spring when birds sing more clearly? Or do leaves and wind affect fall detection?
| Threshold | Interpretation | Use Case |
|---|---|---|
| > 0.90 | Very high confidence | Pretty safe to assume correct ID — good for data logging, biodiversity reports. |
| 0.80 – 0.90 | High confidence | Likely correct, but worth a second look if species are similar-sounding. |
| 0.70 – 0.80 | Medium confidence | Can include false positives — OK for casual monitoring but be cautious with rare species. |
| < 0.70 | Low confidence | Often unreliable — treat with skepticism unless you can verify it manually. |
Final Thoughts
BirdNET-Pi brings a beautiful blend of AI and ecology right into our backyards. And while the tech behind it is complex, tools like confidence scores help demystify the magic. With a bit of data-savvy, we can turn raw detection logs into meaningful insights—and maybe even uncover some surprises along the way.
Whether you’re a seasoned birder, a teacher running a school science project (ahem!), or just someone who loves the dawn chorus, take a closer look at your confidence data. You might find there’s more certainty (and more mystery) in the garden than you realized.
Comments